Gold at $5,000: What a Divided Fed, a Partial Shutdown, and Record ETF Inflows Are Telling You About the Market

WiseGold Weekly Pulse | February 20, 2026
Coverage Period: February 14, 2026 (00:00:00 EST) to February 20, 2026 (11:00:00 EST)
Executive Summary
The past week saw financial markets navigating a complex interplay of divided central bank signaling, persistent geopolitical risks, and mixed economic data. The Federal Reserve’s latest FOMC minutes revealed a growing divergence among officials on the future path of monetary policy, with some members seeing the potential for further rate hikes while others are leaning toward cuts, creating an environment of uncertainty for investors [1]. This policy ambiguity was set against a backdrop of significant geopolitical developments, including a partial US government shutdown, ongoing negotiations to de-escalate the Russia-Ukraine conflict, and heightened tensions in the Middle East [3]. While US labor market data remained robust, GDP growth for the fourth quarter of 2025 missed expectations, and inflation continued to run above the Fed’s target, further complicating the outlook for risk assets [2]. In this environment, precious metals demonstrated notable resilience, with gold prices climbing on safe-haven demand and continued central bank buying, suggesting a potential decoupling from traditional drivers like the US dollar [4].
Key Takeaways:
- Fed’s Divided Outlook: FOMC minutes reveal a significant split on future rate policy, increasing market uncertainty.
- Geopolitical Crosscurrents: A partial US government shutdown and shifting global risk dynamics are influencing market sentiment.
- Mixed US Economic Data: Resilient labor markets contrast with slowing GDP growth and persistent inflation.
- Precious Metals Strength: Gold shows upward momentum, driven by safe-haven demand and central bank purchases.
- Energy Market Volatility: Oil prices fluctuated on OPEC+ supply signals and geopolitical tensions.
Market & Macro Week-in-Review Timeline
- Sat Feb 14: A partial US government shutdown begins as Homeland Security funding expires [3]. Ukrainian President Volodymyr Zelensky signals readiness for elections under a sustained ceasefire ahead of trilateral talks [3].
- Tue Feb 17: US-Ukrainian-Russian talks commence in Geneva, aimed at de-escalating the ongoing conflict [3]. Gold spot price is recorded at $4,913.08 per ounce [4].
- Wed Feb 18: FOMC minutes from the January meeting are released, revealing a significant division among Federal Reserve officials regarding the future path of interest rates [1].
- Thu Feb 19: The Department of Labor reports that initial jobless claims for the week ending February 14 fell to 206,000, indicating continued labor market tightness [2]. The 10-year Treasury yield holds steady around 4.075% [5].
- Fri Feb 20: The US Supreme Court invalidates former President Trump’s broad emergency tariffs, causing the US Dollar Index (DXY) to ease [6]. WTI crude oil prices close around $66.43 per barrel [7], and gold futures for February 2026 settle at $5,071.00 [4].
Thematic Deep Dives
Macro & Monetary Policy
Central banks globally are navigating a complex environment of persistent inflation and slowing growth, leading to divergent policy signals. The past week’s developments have underscored the lack of a synchronized global monetary policy response, creating a challenging backdrop for financial markets.
- Federal Reserve: The latest FOMC minutes from the January meeting revealed a significant division among officials. While the consensus was to hold the benchmark interest rate at 3.50–3.75%, a notable split emerged regarding the future path of policy. Several members expressed openness to further rate hikes if inflation remains stubbornly above target, while another contingent saw the potential for rate cuts should the economy cool as anticipated [1].
- European Central Bank & Bank of England: The ECB held its key rates steady, reaffirming its data-dependent approach and noting the Eurozone economy’s resilience [8]. Similarly, the Bank of England maintained its Bank Rate at 3.75%, though the vote was a narrow 5–4 majority. The BoE’s commentary suggested that the risk of persistent inflation has become less pronounced, opening the door for potential rate reductions later in the year [14].
- Bank of Japan: In contrast to its Western counterparts, the Bank of Japan is facing mounting expectations of a potential interest rate hike. A majority of economists now anticipate the BoJ will raise its key policy rate to 1% by the end of June 2026, a move that could have significant implications for global capital flows and currency markets [13].
This divergence in monetary policy guidance from the world’s major central banks is a critical theme for investors. The Federal Reserve’s internal debate highlights the profound uncertainty surrounding the US economic outlook, with the central bank seemingly caught between the competing risks of persistent inflation and a potential labor market slowdown. While the ECB and BoE appear to be on a more cautious, wait-and-see footing, the prospect of a significant policy shift from the Bank of Japan introduces a new layer of complexity to the global financial landscape. This unsynchronized and unpredictable monetary policy environment is likely to contribute to continued market volatility in the months ahead.
Inflation & Growth Data
Recent economic data releases have painted a mixed picture of the US economy, with a resilient labor market contrasting with signs of slowing growth and persistent, albeit moderating, inflation. This combination of conflicting signals is making it difficult for policymakers and investors to get a clear read on the economic trajectory.
- Inflation: The Consumer Price Index (CPI) for the year ending in January rose by 2.4%, a slight decrease from the previous month’s 2.7% reading. While this indicates a continued, gradual disinflationary trend, inflation remains above the Federal Reserve’s 2% target [2].
- GDP Growth: The second estimate for fourth-quarter 2025 GDP growth came in at an annualized 1.4%, a significant miss from the 3% forecast. This suggests that the US economy lost momentum at the end of last year [19].
- Labor Market: The labor market remains a source of strength. Initial jobless claims for the week ending February 14 fell to 206,000, a drop of 23,000 from the prior week’s revised figure of 229,000, and lower than expected, indicative of a tight labor market [18].
- Consumer Spending: US retail sales were reported to have flatlined in February, suggesting that consumer spending, a key driver of the US economy, may be starting to soften [2].
The latest batch of economic data presents a conundrum for the Federal Reserve. The strong labor market and persistent inflation could argue for a more hawkish policy stance, while the slowing GDP growth and softening consumer spending suggest that the economy may be more vulnerable than previously thought. This data-dependent environment means that every new economic release will be closely scrutinized by the markets for clues about the Fed’s next move. The upcoming releases of the Producer Price Index (PPI) and the next jobs report will be particularly critical in shaping the near-term outlook.
Rates & Yield Curve Dynamics
The US Treasury market was a focal point of investor attention this past week, with yields reacting to the crosscurrents of mixed economic data, a divided Federal Reserve, and shifting geopolitical risk perceptions. The yield curve remains a critical barometer of economic expectations, and its recent behavior reflects the market’s struggle to price in a clear and consistent outlook.
- 10-Year Treasury Yield: The benchmark 10-year Treasury yield fluctuated within a narrow range, ending the week around 4.1%. The yield was influenced by a confluence of factors, including a weaker-than-expected GDP print, persistent inflation data, and safe-haven demand spurred by geopolitical tensions [5].
- Yield Curve Shape: The yield curve remains inverted, with the 2-year Treasury yield at approximately 3.47% and the 10-year yield at 4.075% as of February 19th. This inversion, a historical predictor of recessions, has persisted for an extended period, reflecting the market’s ongoing concerns about the potential for an economic downturn [5].
- Credit Spreads: The ICE BofA US High Yield Index Option-Adjusted Spread, a measure of the premium investors demand for holding high-yield corporate debt, stood at 2.88% on February 19th. This relatively tight spread suggests that, despite the economic uncertainty, investors are not yet pricing in a significant risk of widespread corporate defaults [9].
The dynamics of the Treasury market provide a nuanced view of the current investment landscape. The persistent yield curve inversion signals that bond investors remain cautious about the long-term growth outlook, even as the labor market remains tight. The relatively contained level of credit spreads, however, suggests that the market is not yet in a state of panic. The interplay between these factors will be crucial to watch in the coming weeks, as any significant steepening of the yield curve or widening of credit spreads could signal a shift in market sentiment.
FX & Dollar Landscape
The US dollar experienced a volatile week, with the DXY index ultimately easing despite being poised for a weekly gain at one point. The dollar’s movements were driven by a combination of domestic legal developments, shifting monetary policy expectations, and the broader risk environment.
- US Dollar Index (DXY): The DXY closed the week around 97.80. The index saw upward pressure early in the week, supported by the hawkish undertones in the FOMC minutes. However, a US Supreme Court ruling that invalidated former President Trump’s broad emergency tariffs caused the dollar to pare its gains [6].
- Major Currency Pairs: The euro traded at approximately 1.1779 against the dollar, while the Japanese yen stood at 155.16 per dollar. The British pound was trading at 1.3485 against the dollar [6].
The dollar’s performance this week highlights the complex set of factors currently influencing currency markets. While the prospect of a more hawkish Federal Reserve provided a tailwind for the dollar, the unexpected Supreme Court decision served as a reminder of the potential for legal and political developments to impact the currency. The dollar’s role as a safe-haven asset also came into play, with geopolitical tensions providing some support. The interplay between these competing drivers is likely to keep the dollar in a state of flux in the near term.
Energy & Broader Commodities Context
Energy markets were characterized by a tug-of-war between potential supply increases and underlying demand strength, with geopolitical factors adding a layer of volatility. The week saw crude oil prices trend higher, while natural gas prices came under pressure from inventory data.
- Crude Oil: West Texas Intermediate (WTI) crude oil prices saw a notable increase, ending the week around $66.43/bbl. The market was initially rattled by reports that OPEC+ was considering an increase in oil output starting in April [17]. However, the cartel and its allies reaffirmed their commitment to market stability, which, combined with heightened geopolitical risks, provided a floor for prices. Brent crude futures for April delivery were trading around $71.66/bbl [7].
- Natural Gas: Natural gas prices experienced a decline, with March Nymex futures falling after the Energy Information Administration (EIA) reported a smaller-than-expected withdrawal from inventories of -144 bcf, below the expected -149 bcf. This suggested that, despite some pockets of cold weather, overall demand for heating fuel was not as strong as anticipated [16].
The energy complex is currently in a state of delicate balance. While the prospect of increased OPEC+ supply could act as a headwind for prices, the ongoing geopolitical tensions and the International Energy Agency’s (IEA) forecast for robust long-term electricity demand are providing underlying support. The market will be closely watching the upcoming OPEC+ meeting for any concrete decisions on production policy.
Precious Metals Focus
Precious metals demonstrated notable strength and resilience over the past week, with gold leading the complex higher. The sector benefited from a confluence of factors, including safe-haven demand driven by geopolitical uncertainty, continued accommodative central bank policies, and robust physical demand from both investors and central banks. This performance suggests a potential decoupling of precious metals from their traditional inverse relationship with the US dollar.
Price Ranges:
- Gold: Traded roughly between $4,913/oz and $5,073/oz during the period [4].
- Silver: Traded roughly between $74/oz and $81/oz during the period [4].
- Platinum: Traded roughly between $2,010/oz and $2,175/oz during the period [4].
- Palladium: Traded roughly between $1,673/oz and $1,726/oz during the period [4].
Positioning: Data from February 16th indicated that speculative long positions in both gold and silver had reached 11-month lows, suggesting that the recent price rally may have been driven more by fundamental factors than by speculative fervor [12]. ETF flows, however, told a different story, with January seeing record inflows into physically-backed gold ETFs, totaling $19 billion, making it the strongest month on record [11].
Central Bank Demand: Central banks remained a key source of demand for gold. The People’s Bank of China reported its 15th consecutive month of gold purchases in January, increasing its holdings by 1.2 tonnes to 2,308 tonnes [10]. The broader trend of central bank diversification away from the US dollar is expected to continue providing a long-term tailwind for the gold price.
The precious metals complex is currently benefiting from a powerful combination of supportive factors. The ongoing geopolitical uncertainty is burnishing gold’s appeal as a safe-haven asset, while the dovish tilt of some central banks is reducing the opportunity cost of holding non-yielding assets. The strong physical demand from both investors and central banks provides a solid foundation for the market. While the recent washout in speculative positioning could be seen as a bullish sign, the market will need to see a sustained break above key technical levels to confirm the next leg of the rally.
Credit & Liquidity
Credit markets remained relatively sanguine this past week, with high-yield spreads holding at tight levels. This suggests that, despite the macroeconomic and geopolitical uncertainties, investors are not yet pricing in a significant risk of widespread corporate defaults. The ICE BofA US High Yield Index Option-Adjusted Spread stood at 2.88% on February 19th, a level that indicates a relatively benign environment for corporate credit [9]. However, this apparent calm could be deceptive, and any deterioration in the economic outlook or a significant tightening of financial conditions could lead to a rapid widening of spreads.
Equity & Volatility Sentiment
Equity markets exhibited a mixed and somewhat choppy performance over the past week, with major indices showing modest gains. The S&P 500 closed the week at 6,897.12, while the Nasdaq Composite finished at 22,682.73. The CBOE Volatility Index (VIX), a measure of expected market volatility, declined to 18.95 from an opening of 21.74, suggesting a decrease in near-term risk perception [9]. Market sentiment has been characterized by cautious optimism, with investors balancing the positive tailwinds of the AI trade and strong corporate earnings against the headwinds of geopolitical uncertainty and a divided Federal Reserve. The S&P 500’s brief foray above the 7,000 level for the first time was a notable milestone, driven by strong performance in megacap technology stocks [9].
Geopolitics & Strategic Risk
The geopolitical landscape remains a significant source of market risk and uncertainty. The past week saw a number of key developments that have the potential to impact financial markets in the near and medium term.
- US Fiscal Policy: A partial US government shutdown occurred on February 14th due to a lapse in funding for the Department of Homeland Security. This event, the latest in a series of fiscal standoffs, highlights the ongoing political polarization in Washington and the potential for fiscal policy to become a source of market instability [15].
- Russia-Ukraine Conflict: Trilateral talks between the US, Ukraine, and Russia began in Geneva, with Ukrainian President Volodymyr Zelensky signaling a willingness to compromise on key issues. While the talks offer a glimmer of hope for de-escalation, the situation on the ground remains tense, and the risk of a renewed escalation of the conflict cannot be ruled out [20].
- US-China Relations: Tensions between the US and China remain a key long-term strategic risk. While a potential summit between the two countries’ leaders in April could lead to a near-term de-escalation of trade tensions, the underlying strategic competition between the two powers is likely to continue, with significant implications for global supply chains and technology competition [3].
- Middle East: The risk of a direct military conflict between Israel and Iran remains elevated, driven by Iran’s advancing nuclear program. While the market impact of such a conflict would likely be contained unless it spread to the broader region or disrupted oil supplies, it remains a significant tail risk [3].
These geopolitical flashpoints are creating a complex and challenging environment for investors. The combination of fiscal uncertainty in the US, the ongoing war in Ukraine, and the strategic competition between the US and China is a recipe for continued market volatility. Investors will need to pay close attention to these developments and their potential impact on asset prices.
Cross-Asset Interlinkages
- The Federal Reserve’s divided outlook, as revealed in the FOMC minutes, created a ceiling for Treasury yields, which in turn provided a supportive environment for non-yielding assets like gold [1, 5].
- Heightened geopolitical risks, particularly the partial US government shutdown and the ongoing Russia-Ukraine conflict, fueled safe-haven demand for both the US dollar and precious metals [3, 4, 6].
- Softer-than-expected US GDP growth data for the fourth quarter of 2025 weighed on equity market sentiment and contributed to the easing of the US dollar towards the end of the week [2, 6, 9].
- The resilience of the labor market, as evidenced by the low level of initial jobless claims, provided a floor for equity markets and limited the extent of any risk-off moves [2, 9].
- The potential for a policy shift from the Bank of Japan, with markets pricing in a potential rate hike, contributed to the yen’s relative strength and added another layer of complexity to the global currency landscape [8].
Risk Matrix Snapshot
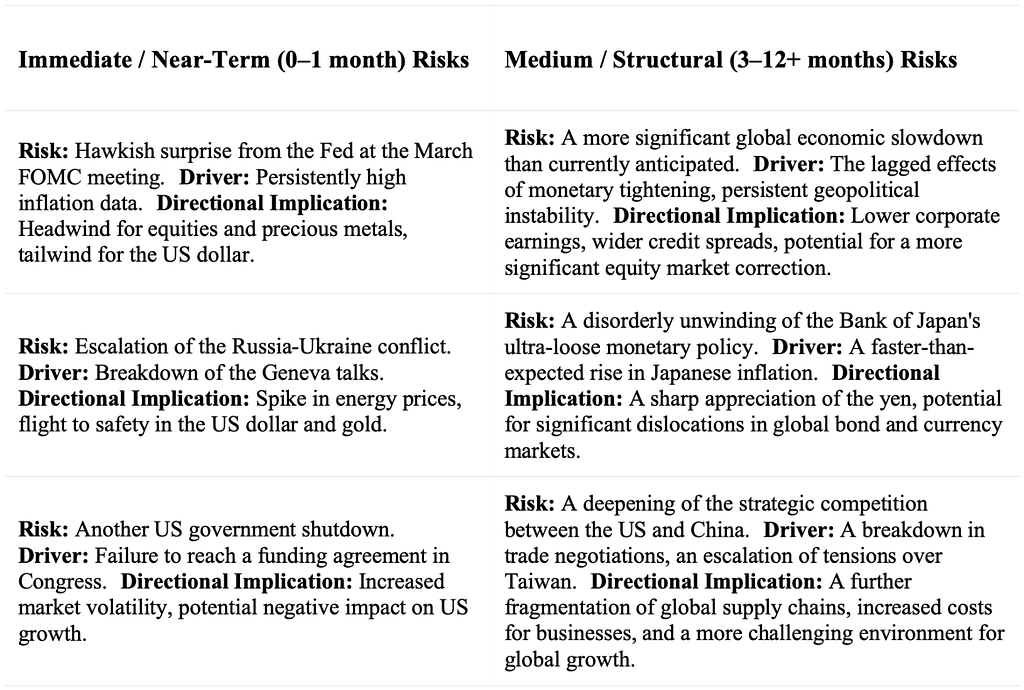
Scenario Watch & Forward Catalysts
- March FOMC Meeting (March 17–18): This will be a critical event for markets, with investors closely watching for any shift in the Fed’s guidance. Probability: Base. Precious Metals Sensitivity: A hawkish surprise would be a potential headwind for bullion, while a more dovish tone would likely be supportive.
- US February Jobs Report (Early March): This will provide a key update on the health of the US labor market and will be a critical input into the Fed’s decision-making process. Probability: Base. Precious Metals Sensitivity: A strong report could weigh on gold prices, while a weaker report would likely be bullish.
- Developments in the Russia-Ukraine Conflict: The outcome of the Geneva talks and the situation on the ground will be closely monitored by markets. Probability: Elevated. Precious Metals Sensitivity: Any escalation of the conflict would likely lead to a flight to safety, benefiting gold.
Portfolio Context & Implications
The developments of the past week underscore the importance of maintaining a well-diversified portfolio that is resilient to a range of potential outcomes. The current environment of heightened uncertainty, with its conflicting economic signals, divergent central bank policies, and elevated geopolitical risks, argues against making large, directional bets. Instead, the focus should be on building portfolios that can weather volatility and protect capital in a variety of scenarios. The strong performance of precious metals in this environment serves as a timely reminder of their potential role as a portfolio diversifier and a hedge against uncertainty. The ongoing trend of central bank gold buying also suggests that the official sector continues to see value in holding gold as a reserve asset, a trend that could provide a long-term tailwind for the metal.
Precious Metals Strategic Thesis
Diversification Attribute
Precious metals, particularly gold, have historically exhibited a low to negative correlation with traditional financial assets such as stocks and bonds. This means that the price of gold often moves independently of, or even in the opposite direction to, these other asset classes. This characteristic makes gold a potentially valuable tool for portfolio diversification. By including an allocation to gold in a broader portfolio, investors may be able to reduce overall portfolio volatility and improve risk-adjusted returns, especially during periods of market stress.
Wealth Protection & Purchasing Power
Over long periods of history, gold has served as a reliable store of value, preserving wealth and purchasing power in the face of inflation and currency debasement. Unlike fiat currencies, which can be created in unlimited quantities by central banks, the supply of gold is finite and grows at a slow and predictable rate. This inherent scarcity has made gold a trusted anchor of value for centuries. In an era of unprecedented monetary expansion and rising inflationary pressures, the role of gold as a protector of purchasing power is more relevant than ever.
Drawdown Mitigation & Crisis Optionality
Gold has a long and proven track record of performing well during periods of financial crisis and market turmoil. When other assets are falling in value, gold often rallies, providing a valuable source of portfolio protection. This “crisis alpha” is a key reason why many investors turn to gold during times of uncertainty. In addition to its role as a safe-haven asset, gold also provides a form of “crisis optionality.” In a severe financial crisis, when traditional financial assets may become illiquid or even worthless, gold can serve as a universally accepted medium of exchange and a ultimate store of value.
Structural Demand Drivers
Beyond its role as a monetary asset and a safe-haven investment, gold also benefits from a diverse set of structural demand drivers. These include its use in jewelry, technology, and dentistry. In addition, the ongoing trend of central bank diversification away from the US dollar is creating a significant and growing source of demand for gold. As emerging market central banks, in particular, seek to increase their holdings of gold as a reserve asset, this is likely to provide a long-term tailwind for the gold price.
Allocation Framing
From a portfolio construction perspective, the question of how much to allocate to precious metals is a complex one with no single right answer. The optimal allocation will depend on a variety of factors, including an investor’s individual risk tolerance, time horizon, and investment objectives. However, a review of the academic and historical literature can provide some useful guideposts. A number of studies have suggested that a strategic allocation to gold in the range of 2% to 10% of a diversified portfolio can have a beneficial impact on risk-adjusted returns. It is important to note that these are generalized findings and should not be taken as a specific recommendation. The decision of whether and how much to allocate to precious metals should be made in consultation with a qualified financial advisor.
Summary Capsule
- Macro Pulse: A divided Fed, mixed US economic data, and persistent geopolitical risks are creating a complex and uncertain environment for financial markets.
- Metals Stance: Precious metals, particularly gold, are demonstrating notable strength and resilience, benefiting from safe-haven demand and continued central bank buying.
- Risk Tone: The overall risk tone is cautious, with investors grappling with a range of near-term and structural risks.
- Positioning Nuance: While speculative positioning in precious metals has been light, strong ETF inflows and central bank demand are providing a solid foundation for the market.
- Forward Watch: The upcoming March FOMC meeting and the next US jobs report will be critical catalysts for markets.
- Structural Theme: The ongoing trend of central bank diversification away from the US dollar is a key long-term tailwind for gold.
Source List
[1] IDNFinancials — FOMC minutes show the Fed agreed to hold rates, AI impact in focus — February 19, 2026 — https://www.idnfinancials.com/news/61478/fomc-minutes-show-the-fed-agreed-to-hold-rates-ai-impact-in-focus [2] Axios — Fed minutes show widening divide over rate cuts — February 18, 2026 — https://www.axios.com/2026/02/18/fed-interest-rates-minutes-january [3] Wellington Management — Geopolitics in 2026: Risks and opportunities we’re watching — January 2026 — https://www.wellington.com/en-nl/institutional/insights/geopolitics-in-2026-risks-and-opportunities-were-watching [4] MarketWatch — GCG26 | Gold Feb 2026 Overview — Unknown — https://www.marketwatch.com/investing/future/gcg26?gaa_at=eafs&gaa_n=AWEtsqdFGFHMHfGyZbr_L_bBanvgTfS4cEQh9Mt1h74o6muE8wJHGT-R2Iku&gaa_ts=6998be15&gaa_sig=WNWJEJbHARDfdyGgcUQtkFAO9KUoUDoxMHCWD5dEASpw0zjmGwPq6OPbTFOD9l3mOWv6LWVBU5pCVavaGRB-QA%3D%3D [5] CNBC — U.S. Treasury yields: investors await more economic data — February 19, 2026 — https://www.cnbc.com/2026/02/19/us-treasury-yields-investors-await-more-economic-data.html [6] Trading Economics — United States Dollar — Quote — Chart — Historical Data — News — Unknown — https://tradingeconomics.com/united-states/currency[7] Investing.com — Crude Oil WTI Futures Historical Data — February 20, 2026 — https://www.investing.com/commodities/crude-oil-historical-data [8] European Central Bank — Monetary policy decisions — February 5, 2026 — https://www.ecb.europa.eu/press/pr/date/2026/html/ecb.mp260205_001d26959b.en.html.md [9] Yahoo Finance / FRED — S&P 500, VIX, ICE BofA US High Yield Index Option-Adjusted Spread (BAMLH0A0HYM2) — February 20, 2026 — https://fred.stlouisfed.org/series/BAMLH0A0HYM2 [10] Reuters — China’s central bank buys gold for 15th consecutive month — February 7, 2026 — https://www.reuters.com/world/china/chinas-central-bank-buys-gold-15th-consecutive-month-2026-02-07/ [11] World Gold Council — Gold ETF Flows: January 2026 — February 2026 — https://www.gold.org/goldhub/research/gold-etfs-holdings-and-flows/2026/02 [12] Stonex — Commodity Futures Positioning: Metals & Oil | COT Report — February 16, 2026 — https://www.stonex.com/en/market-intelligence/commodity-futures-positioning-metals-oil-cot-report-16-feb-2026/ [13] Reuters — BOJ to hike policy rate to 1% by end-June, sooner than forecast — February 19, 2026 — https://www.reuters.com/world/asia-pacific/boj-hike-policy-rate-1-by-end-june-sooner-than-forecast-before-election-2026-02-19/ [14] Bank of England — Monetary Policy Report — February 2026 — https://www.bankofengland.co.uk/monetary-policy-report/2026/february-2026 [15] Committee for a Responsible Federal Budget — Upcoming Congressional Fiscal Policy Deadlines — February 17, 2026 — https://www.crfb.org/blogs/upcoming-congressional-fiscal-policy-deadlines [16] Barchart.com — Natural Gas Futures Price — February 19, 2026 — https://www.barchart.com/futures/quotes/NGG26 [17] XTB.com — Oil prices plummet amid rumors of further OPEC production increases — February 13, 2026 — https://www.xtb.com/cy/market-analysis/news-and-research/breaking-oil-prices-plummet-amid-rumors-of-further-opec-production-increases [18] Reuters — US weekly jobless claims fall more than expected — February 19, 2026 — https://www.reuters.com/world/us/us-weekly-jobless-claims-fall-more-than-expected-amid-labor-market-stability-2026-02-19/ [19] CNBC — Fourth-quarter U.S. GDP up just 1.4%, badly missing estimate — February 20, 2026 — https://www.cnbc.com/2026/02/20/pce-inflation-december-2025.html [20] Institute for the Study of War — Russian Offensive Campaign Assessment, February 14, 2026 — February 14, 2026 — https://understandingwar.org/research/russia-ukraine/russian-offensive-campaign-assessment-february-14-2026/
Methodology & Notes
This report was compiled by synthesizing information from a range of publicly available and credible financial news sources, central bank websites, and data providers. All data and events cited fall within the specified coverage period. Price ranges for commodities and precious metals are approximated based on available daily data. All timestamps are in Eastern Standard Time (EST) unless otherwise noted. The report includes developments up to and including the 10:00 AM EST data releases on Friday, February 20, 2026, to provide the most timely and relevant analysis.
Disclosure
This report is for informational purposes only and does not constitute investment advice, a recommendation, an offer, or a solicitation to buy or sell any financial instrument. The views expressed are based on publicly available information believed to be reliable, but accuracy or completeness cannot be guaranteed. Past performance is not indicative of future results. Readers should conduct their own analysis and consult qualified professionals before making any financial decisions.
#WiseGold #Gold #PreciousMetals #MacroEconomics #FederalReserve #FinancialMarkets #WealthManagement #FinancialAdvisors #MonetaryPolicy #Investing #Commodities #MarketOutlook